• CoT Report and how to analyse

    Reading the Commitment of Traders (COT) report for trading Nasdaq 100 (NQ) futures involves analyzing the positions and behavior of different types of traders to gain insights into market sentiment and potential future price movements. Here’s a step-by-step guide on how to read and interpret the COT data for trading NQ futures:

    1. Access the COT Report

    • The COT report is published weekly by the Commodity Futures Trading Commission (CFTC) every Friday at 3:30 PM EST, reflecting data as of the previous Tuesday.
    • You can access the report on the CFTC website or through financial data providers that offer COT data in a more user-friendly format.

    2. Understand the COT Categories

    The COT report is divided into several categories:

    • Commercials: These are hedgers who use futures to hedge their business activities.
    • Producer/Merchant/Processor/User: Entities involved in the production or consumption of the commodity.
    • Swap Dealers: Financial institutions hedging risks related to swaps.
    • Non-Commercials (Large Speculators): These are speculative traders.
    • Managed Money: Includes hedge funds and other professional money managers.
    • Other Reportables: Large traders not classified under Managed Money.
    • Small Speculators: Individual traders or smaller entities with smaller positions.

    3. Analyze the Data

    Focus on key elements of the report:

    • Open Interest: The total number of outstanding contracts.
    • Long Positions: The number of contracts held with the expectation that prices will rise.
    • Short Positions: The number of contracts held with the expectation that prices will fall.
    • Changes from Previous Week: Pay attention to the changes in long and short positions from the previous week, as this can indicate shifting sentiment.

    4. Identify Trends and Sentiment

    • Commercials: Typically act as contrarian indicators. If commercials are heavily long, they expect lower prices in the future, and vice versa.
    • Non-Commercials (Managed Money): Generally trend-followers. If managed money is heavily long, it suggests a bullish sentiment, and vice versa.
    • Small Speculators: Often considered less informed. Extreme positions by small speculators can be seen as a contrarian indicator.

    5. Look for Extremes and Divergences

    • Extremes in Positioning: Look for extreme long or short positions by commercials or non-commercials. These extremes often precede major price reversals.
    • Divergences: Compare the price action with the positioning of traders. If prices are rising but non-commercials are reducing their long positions, it could signal an impending reversal.

    6. Combine with Technical Analysis

    Use COT data in conjunction with technical analysis to improve your trading decisions:

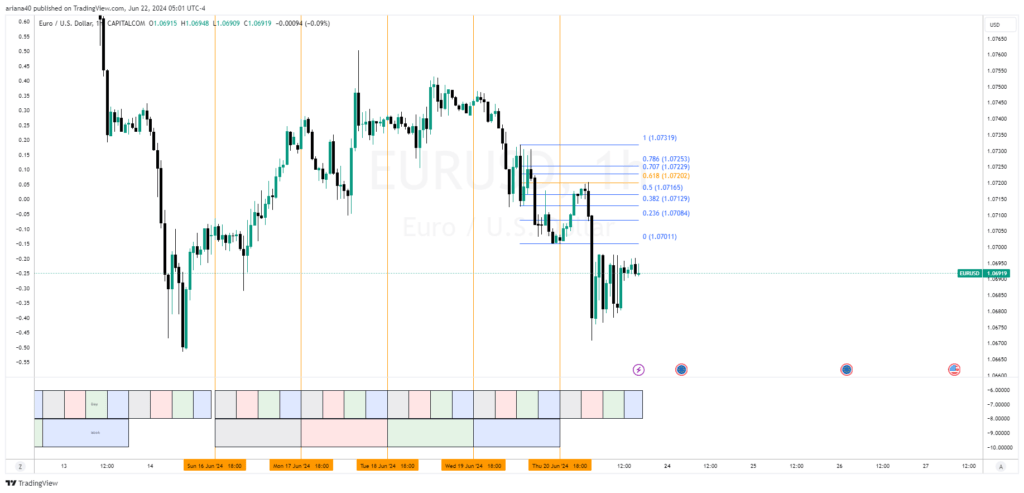
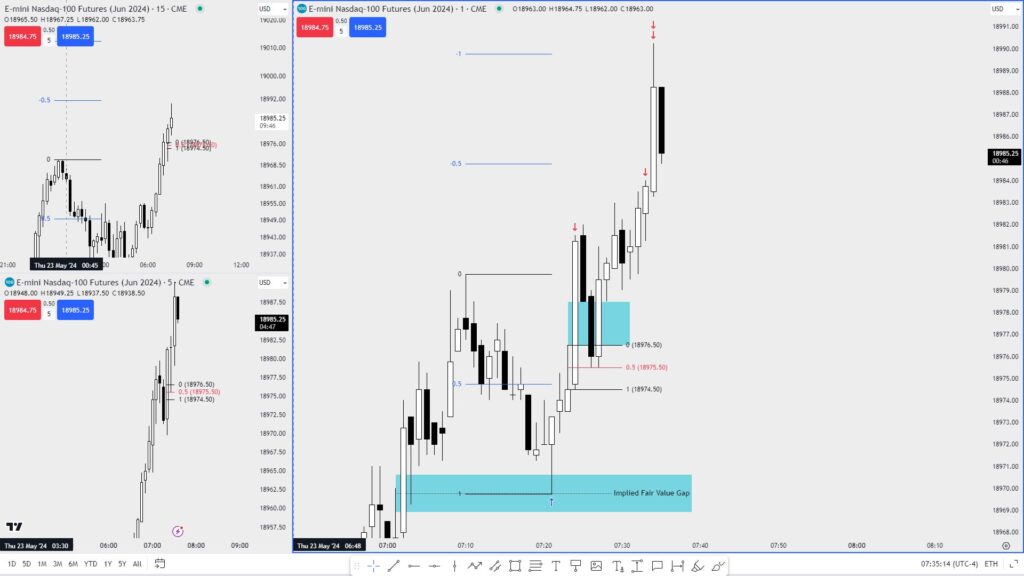
    • Support and Resistance Levels: Identify key support and resistance levels on the NQ futures chart.
    • Trend Analysis: Use moving averages, trendlines, and other indicators to determine the overall trend.
    • Reversal Patterns: Look for chart patterns like head and shoulders, double tops/bottoms, and others that indicate potential reversals.

    7. Formulate a Trading Strategy

    • Contrarian Approach: If commercials are heavily long and non-commercials are heavily short, consider taking a long position anticipating a price increase.
    • Trend-Following Approach: If managed money is increasing long positions and the price trend is up, consider following the trend with a long position.
    • Confirm Signals: Wait for technical confirmation of COT signals, such as a breakout above resistance or a reversal pattern.

    Example of Interpreting COT Data for NQ Futures

    Suppose the COT report shows:

    • Commercials: Increasing long positions significantly.
    • Managed Money: Reducing long positions and increasing short positions.
    • Small Speculators: Extremely long.

    This scenario could indicate a potential market top, as commercials (hedgers) are positioning for lower prices, and managed money (large speculators) is becoming bearish. Small speculators being extremely long adds to the contrarian signal.

    Trading Plan:

    • Look for bearish reversal patterns on the NQ futures chart.
    • Set a sell order below a key support level, with a stop-loss above a recent high.
    • Monitor the market for further confirmation of the bearish sentiment.

    By integrating COT data with your technical analysis and trading strategy, you can make more informed decisions when trading NQ futures.

  • 2010 Flash Crash

    The “2010 Futures Flash Crash,” also known as the “Flash Crash,” occurred on May 6, 2010. During this event, major stock indices in the U.S. suddenly plunged and then recovered within a very short period. Here’s a breakdown of the situation you’re describing:

    1. **Drop Copy**: This is a method used by trading firms to receive copies of trade execution reports in real-time. It helps them monitor and manage their trades.

    2. **Liquidity Cancels**: During the Flash Crash, many trading algorithms and systems rapidly pulled their orders from the market. This caused a sudden drop in liquidity, meaning there were fewer buy and sell orders available.

    3. **Filled Orders and Cancellations**: Some traders might have had their orders filled (i.e., completed) just before the liquidity was pulled. In a highly automated trading environment, this can happen so quickly that traders might not realize their orders were executed until after the fact.

    4. **Poker Analogy**: Imagine you’re playing poker and you decide to go “all in,” betting all your chips. In the next instant, all the other players vanish. In the trading world, this would be akin to placing a large trade and suddenly finding that there’s no one on the other side to complete the transaction, or that the market has drastically changed.

    During the Flash Crash, the rapid withdrawal of liquidity led to extreme volatility and price swings, causing a lot of confusion and losses for many traders. The event highlighted the risks and potential instability of high-frequency trading and algorithmic trading systems.

  • How ICT Identifies the Best Order Blocks: Detailed Insights and Examples for Traders

    How ICT Identifies the Best Order Blocks: Detailed Insights and Examples for Traders

    Choosing the right order block is a crucial aspect of trading according to ICT’s teachings. Here’s a detailed breakdown of how ICT approaches this concept:

    What is an Order Block?

    An order block is a price level where institutions have placed large buy or sell orders. These levels often act as support or resistance in the market.

    Explanation of the Concept

    Order blocks are areas on the chart where significant institutional buying or selling has occurred. These blocks are identified by looking at the price action and understanding where the market has shown a willingness to reverse or continue its trend.

    Why the Concept Works

    The idea behind order blocks is that institutions, which have the power to move markets, leave footprints in the form of these blocks. By identifying these areas, traders can align their trades with the institutional order flow, increasing the probability of success.

    Examples from ICT’s Teachings

    1. Institutional Order Flow: ICT emphasizes that institutional order flow is not visible through traditional tools like volume profile analysis or level 2 data. Instead, it’s about understanding the price action and where institutions are likely to place their orders [1].
    2. Process Thinking: ICT stresses the importance of process thinking in trading. This involves understanding the foundations of why you are making a decision to buy, sell, or stay on the sidelines. It’s not just about identifying an order block but understanding the context around it [2].
    3. Nested Levels: ICT also talks about nested levels within order blocks, such as propulsion blocks. These are smaller order blocks within a larger one, providing additional confirmation for a trade [4].

    Tips for Using Order Blocks

    • Context Matters: Always consider the broader market context. An order block in isolation is not enough; you need to understand the overall market structure and institutional order flow [2].
    • Self-Talk and Analysis: Engage in self-talk to question why the market is reacting at certain levels. This helps in understanding the underlying reasons behind the formation of an order block [8].

    Caveats to Consider

    • Not a Silver Bullet: Order blocks are not the be-all and end-all of trading. They are one tool among many, and relying solely on them without considering other factors can lead to poor trading decisions [8].
    • Experience Required: Identifying and using order blocks effectively requires experience and practice. It’s not something that can be mastered overnight [4].

    By understanding and applying these principles, you can better align your trades with institutional order flow and improve your trading outcomes.

  • Breaker Block vs. Mitigation Block: Key Differences Explained with Index Futures Case Studies

    A breaker block and a mitigation block are both concepts used in trading to understand price action and potential areas of support and resistance, but they have distinct characteristics and uses.

    Breaker Block

    What it is: A breaker block is a price level that acts as a strong resistance or support after a significant price move. It is formed when a previous high or low is taken out, and the price retraces to that level.

    Explanation: For a bearish breaker, you would see a high, a low, and then a higher high. The low between these highs is the breaker block. When the price retraces to this low, it often acts as a strong resistance level.

    Why it works: Breaker blocks are significant because they represent areas where institutional traders might have had losing positions that they want to mitigate when the price returns to that level. This creates a strong resistance or support.

    Example: In the context of indices futures, if the NASDAQ forms a high, a low, and then a higher high, the low between these highs becomes the bearish breaker. When the price retraces to this level, it often acts as a strong resistance, preventing the price from moving higher [1].

    Tips: Use breaker blocks as key levels for potential reversals or strong resistance/support. They are generally more formidable than mitigation blocks.

    Caveats: While breaker blocks are strong, they are not infallible. Prices can still move through them, so always use proper risk management.

    Mitigation Block

    What it is: A mitigation block is similar to a breaker block but is generally considered weaker. It is formed when a high, a low, and a higher high occur, but the price does not make a lower low.

    Explanation: For a mitigation block, you would see a high, a low, and then a higher high, but the price does not make a lower low. The low between these highs is the mitigation block.

    Why it works: Mitigation blocks are areas where institutional traders might want to mitigate their positions. However, they are not as strong as breaker blocks because they can be traded through more easily.

    Example: In the NASDAQ, if you see a high, a low, and then a higher high without a lower low, the low between these highs is the mitigation block. This level can act as a target for price action but is not as strong as a breaker block [2].

    Tips: Use mitigation blocks more for targeting purposes rather than entries, as they can be traded through more easily than breaker blocks.

    Caveats: Mitigation blocks are not as strong as breaker blocks and can be less reliable for predicting reversals. They are better used for identifying potential target areas rather than strong support/resistance levels.

    Case Study in Indices Futures

    In the NASDAQ futures, if you observe a high, a low, and then a higher high, the low between these highs can be a mitigation block. If the price retraces to this level, it might act as a target but not necessarily a strong resistance. Conversely, if you see a high, a low, and then a higher high with a subsequent lower low, the low between these highs becomes a bearish breaker. This level is more likely to act as a strong resistance when the price retraces to it [1] [2].

    By understanding these concepts, you can better anticipate potential price movements and make more informed trading decisions.

  • Bearish Breaker is much more stronger than a mitigation block

    In this video ICT explains difference between a breaker and a mitigation block.

    https://youtu.be/vN2BkfyRWE4?t=1343

  • Leveraging NASDAQ 100 Behavior and Inter-Index Relationships for Smarter Trading Decisions

    Below are some key ideas which you can look into while trading Indices:

    1. High Frequency Trading Algorithm:
      • Concept: High frequency trading algorithms look for disparities among different market averages.
      • Example: If the NASDAQ is leading to the upside but the S&P 500 (ES) is lagging, a high frequency trading algorithm might identify this disparity and anticipate that the S&P 500 will eventually catch up. This is known as the “sick sister” concept, where the lagging index eventually gains strength and moves in sympathy with the leading index [3].
    2. Relative Strength Analysis:
      • Concept: When trading indices, it’s important to identify which index is showing the strongest price delivery.
      • Example: During an FOMC event, if the NASDAQ is showing stronger bullish behavior compared to the S&P 500 (ES), it makes more sense to trade the NASDAQ for long positions. The NASDAQ’s strength indicates it is the leader, and the S&P 500 will likely follow its movement [6].
    3. Sympathetic Price Rally:
      • Concept: When one index leads in performance, other indices may follow in a sympathetic rally.
      • Example: If the NASDAQ has been the upside performer, the S&P 500 (ES) may also rise in sympathy. This means that even if the NASDAQ has already moved up, traders can still take trades in the S&P 500, expecting it to catch up to the NASDAQ’s performance [4].
    4. Inefficiency and Fair Value Gaps:
      • Concept: Identifying inefficiencies and fair value gaps can help in predicting price movements.
      • Example: In a trading session, if there’s an inefficiency in the NASDAQ that gets traded back into and then rallies up, traders can use this information to anticipate further price movements. For instance, if a bullish breaker is identified, it can signal a potential upward move, as seen when the NASDAQ retraced up 20-30% on its range and then continued higher [7].

    These examples illustrate how understanding the behavior of the NASDAQ 100 and its relationship with other indices can provide valuable insights for trading decisions.

  • Mastering Optimal Trade Entry Strategies for Successful Forex and Futures Trading

    An optimal trade entry (OTE) is a concept taught by ICT (Inner Circle Trader) that involves identifying the most favorable point to enter a trade based on specific retracement levels. Here’s a detailed explanation of how to use an optimal trade entry to trade:

    What is an Optimal Trade Entry (OTE)?

    An optimal trade entry is a specific point within a price retracement where the probability of a successful trade is higher. It typically involves using Fibonacci retracement levels, particularly the 62% to 79% retracement levels, to identify these points.

    Explanation of the Concept

    The idea behind OTE is to find a retracement within a larger price move (impulse leg) where the market is likely to resume its original direction. This retracement is considered an “optimal” point to enter a trade because it offers a favorable risk-to-reward ratio.

    Why the Concept Works

    The OTE works because it leverages the natural ebb and flow of the market. After a significant price movement, the market often retraces to a certain level before continuing in the original direction. By entering at these retracement levels, traders can position themselves to catch the next wave of the price movement.

    Example from the Video

    In one of the examples provided by ICT, he mentions an hourly optimal trade entry that is then broken down into a smaller fractal on a 5-minute chart . He shows how the initial run-up and subsequent retracement on the hourly chart create an optimal trade entry, which is then mirrored on a smaller scale within the 5-minute chart.

    Tips for Using OTE

    1. Identify the Impulse Leg: Start by identifying a significant price movement (impulse leg) from a low to a high (for bullish setups) or a high to a low (for bearish setups).
    2. Use Fibonacci Retracement Levels: Apply Fibonacci retracement levels to the impulse leg. Focus on the 62% to 79% retracement levels as potential entry points.
    3. Look for Confluence: Combine the OTE with other technical analysis tools such as order blocks, market structure shifts, and time of day (e.g., New York session) to increase the probability of success [2].
    4. Manage Your Risk: Always consider the spread and potential slippage. ICT suggests adding a couple of pips to the highest level for your spread to ensure your limit order gets triggered [3].

    Caveats to Consider

    • Market Conditions: The effectiveness of OTE can vary depending on market conditions. It works best in trending markets and may not be as effective in consolidating or choppy markets.
    • Risk of Missing the Entry: Sometimes the price may not retrace exactly to your desired level, causing you to miss the entry. It’s essential to be flexible and consider market dynamics.

    By understanding and applying the concept of optimal trade entry, you can enhance your trading strategy and improve your chances of entering trades at favorable points. Remember, practice and experience are key to mastering this technique.

  • Understanding Implied Fair Value Gap (IFVG) for Better Trading Decisions

    An implied fair value gap (IFVG) is a concept introduced by ICT (Michael J. Huddleston) that refers to a specific type of fair value gap that may not be immediately obvious or visible in the price chart. Unlike a traditional fair value gap, which is a clear gap between two candles, an implied fair value gap involves overlapping wicks of consecutive candles without a distinct gap between their bodies.

    Explanation of the Concept
    An implied fair value gap occurs when the wicks of two consecutive candles overlap, but there is no clear gap between the bodies of these candles. This overlap creates an area of interest that can be used for trading decisions, even though it doesn’t look like a traditional fair value gap.

    Why the Concept Works
    The implied fair value gap works because it represents an area where there was a significant amount of trading activity, but not enough to create a clear gap. This area can act as a support or resistance level, similar to a traditional fair value gap.

    Example from the Video
    In the February 21, 2023, ES Opening Session Commentary, ICT explains that an implied fair value gap is identified by overlapping wicks of two candles. He notes that even though there is no clear gap between the bodies of these candles, the area between the wicks can be used as a reference point for trading decisions.

    Tips for Using the Concept
    Observation: Be vigilant in identifying these overlaps, as they may not be as obvious as traditional fair value gaps.
    Context: Use the implied fair value gap in conjunction with other market analysis tools and concepts to strengthen your trading decisions.
    Practice: Spend time practicing identifying these gaps in historical charts to get a better feel for how they form and how price reacts to them.


    Caveats to Consider
    Misidentification: Be cautious not to misidentify areas as implied fair value gaps. Ensure that the wicks of the candles overlap and that there is no clear gap between the bodies.
    Market Conditions: Like all trading concepts, implied fair value gaps may not work in all market conditions. Always consider the broader market context.
    By understanding and correctly identifying implied fair value gaps, traders can add another layer of analysis to their trading strategy, potentially improving their decision-making process.