Signs of Bearishness Amidst a Spectacular Surge
The S&P 500 is positioned less than 2% away from its previous record high, achieved on January 3, 2022. Simultaneously, the Dow Jones Industrial Average marked three consecutive all-time highs, aiming for a fourth on Monday.
A Centuries-Old Charting Technique Raises Concerns
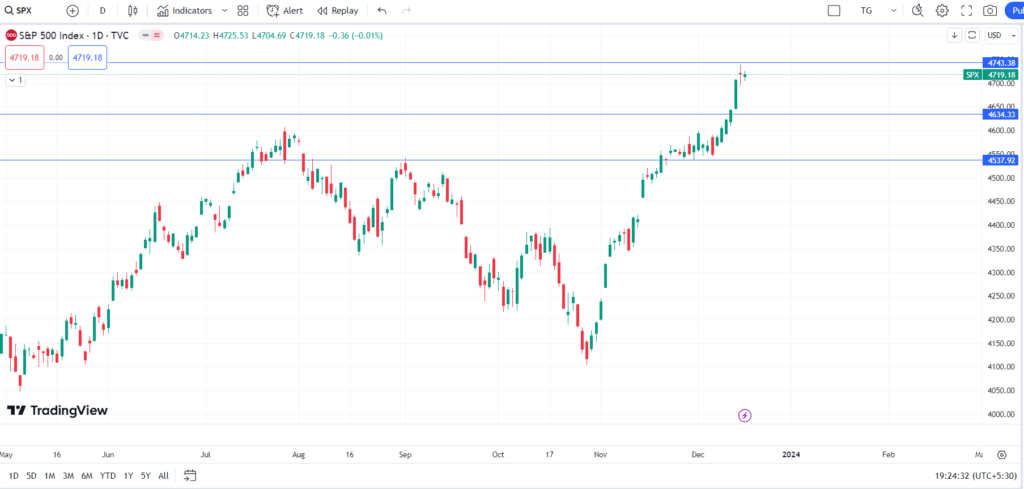
Despite the strong performance, an ominous signal surfaced in the S&P 500’s candlestick charts, a centuries-old charting technique. This could indicate a potential reversal of bullish trends in this closely monitored U.S. stock market index.
The Enigmatic ‘Doji’ Pattern Emerges
Following a robust rally post the Federal Reserve’s latest meeting, the S&P 500 displayed a textbook doji chart on Thursday. Subsequently, a slightly irregular doji formation appeared on Friday, raising questions about the future direction of the market.
Understanding the ‘Doji’ in Candlestick Analysis
In candlestick charts, the ‘doji’ pattern, developed over 200 years ago in Japan, is seen by some market technicians as a psychological indicator. With its thin body and equal-length vertical lines (wicks), the ‘doji’ suggests a moment of indecision in the market.
Interpreting the ‘Doji’ in Market Psychology
Doji patterns, translated as “at the same time,” become significant after substantial gains. Market analysts, such as Steve Nison, note that a doji after an extended rally can indicate potential buyer indecision, potentially leading to a reversal.
Two Successive ‘Dojis’ Point to Market Turbulence
The formation of two dojis in a row, as observed in the S&P 500 on Thursday and Friday, indicates a state of balance between buyers and sellers. Analysts suggest this state of temporary calmness may precede a major market move in either direction.
Bulls and Bears in a Battle of Market Forces
Financial blogger Vladimir Ribakov views the doji pattern as a temporary balance of power between buyers and sellers, likening it to a world war with a knock-out winner. The consecutive formation of dojis raises the likelihood of a strong market move, yet the ultimate victor remains uncertain.
The Optimism Factor: Betting on the Federal Reserve’s Strategy
Market optimism is fueled by investors’ bets on the Federal Reserve not only halting interest rate hikes but also significantly cutting benchmark rates next year. The Fed’s projection of rate cuts, known as the dot plot, suggests potential reductions that could impact overall borrowing costs and support businesses.
The Fed’s Soft Landing Attempt and Economic Outlook
The Fed’s shift from rate hikes to potential cuts has resulted in a pullback in bond yields, supporting a positive outlook for the economy. However, the number of anticipated rate cuts in the coming year raises questions about the economy’s stability, leaving the outcome uncertain for stock bulls and bears alike.
Awaiting the Fed’s Success in 2024
Whether the stock bulls can claim victory over bears hinges on the Federal Reserve’s success in achieving a soft landing in 2024. While the odds appear favorable, the prospect of significant rate cuts raises concerns about the economy’s stability.
